
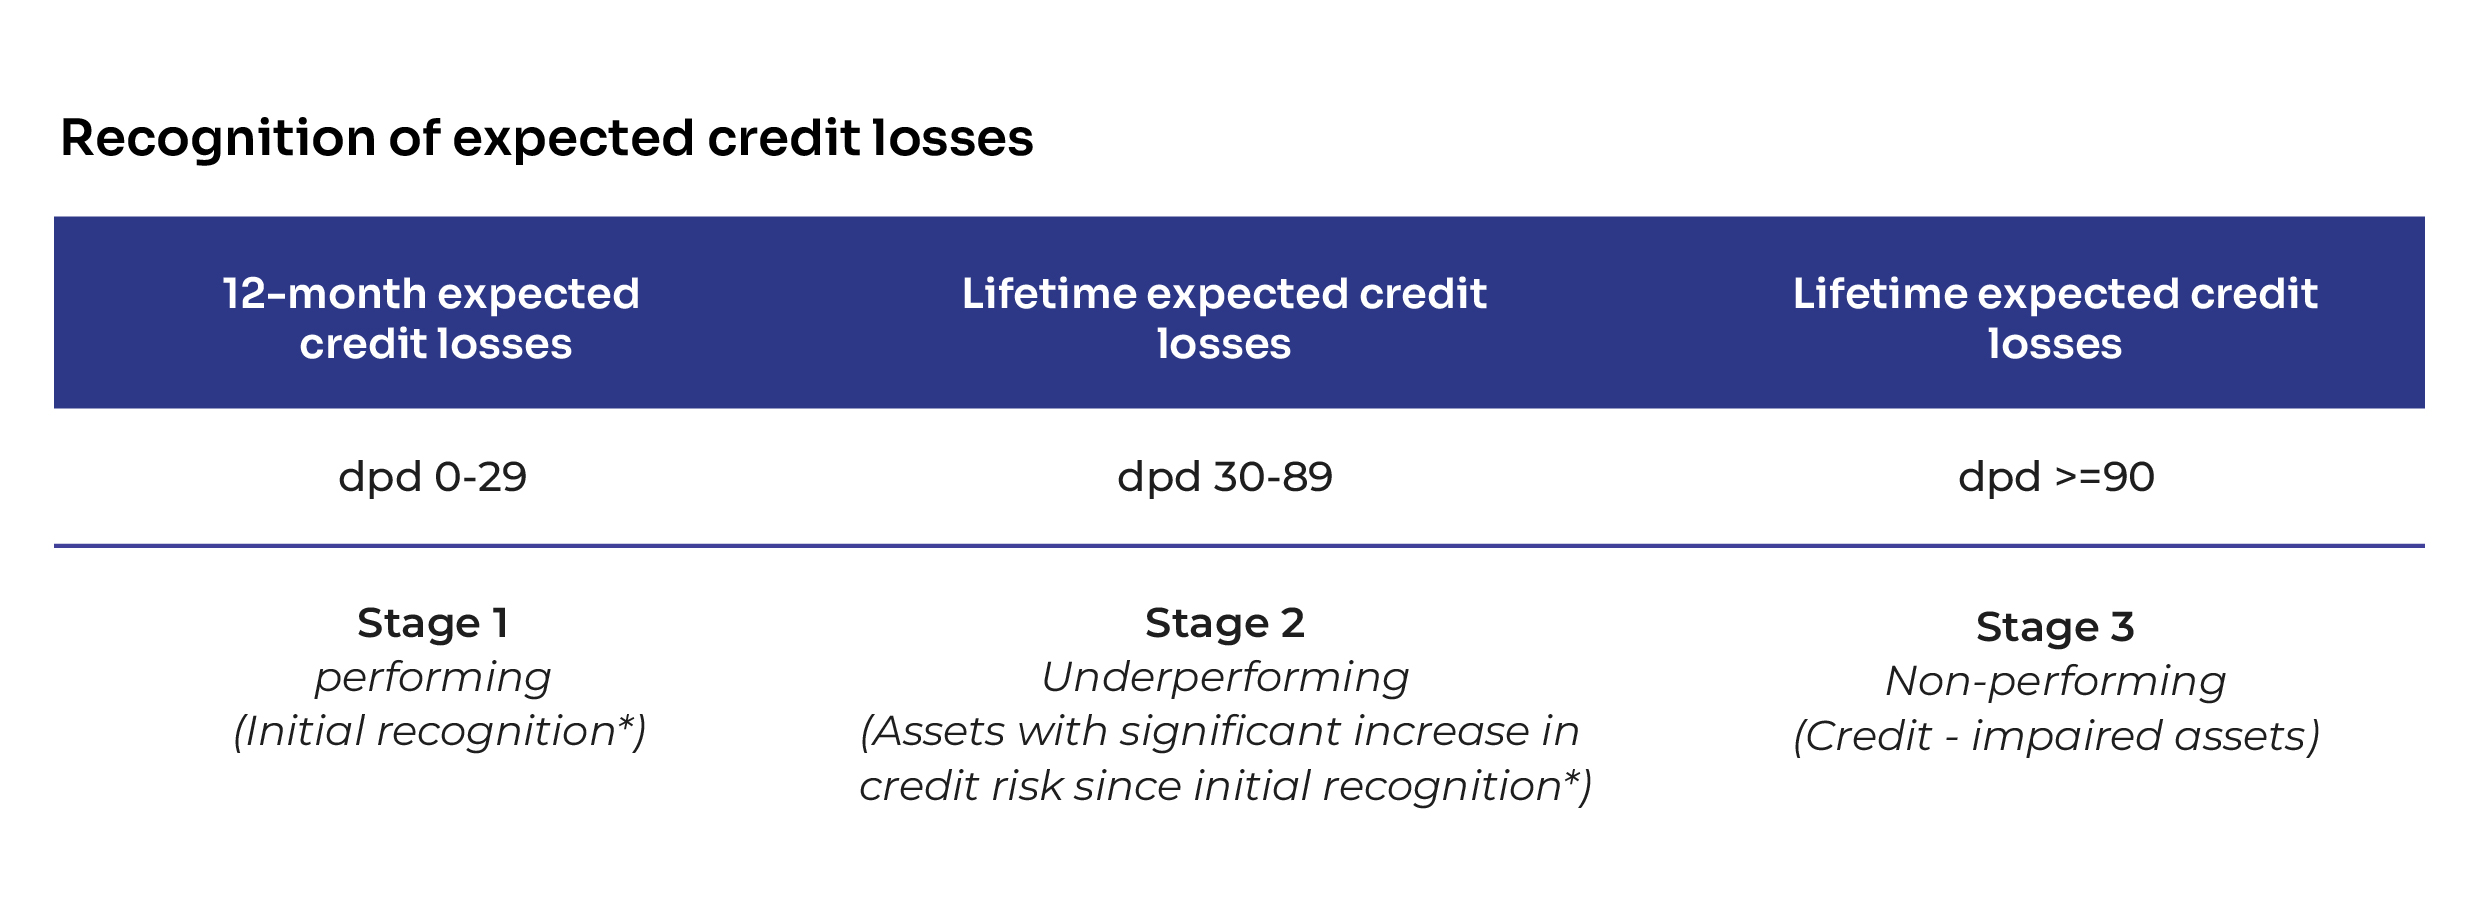
The goal of the Expected Credit Loss (ECL) method is to assess credit risk and determine provisions for potential losses within co-lending portfolios. By adhering to IFRS 9 guidelines, the method ensures timely and accurate provisioning based on the risk profile of loans, enhancing the ability to manage and mitigate credit risk effectively.
The Expected Credit Loss (ECL) model is a forward-looking framework that assesses credit risk by considering a borrower’s likelihood of default, the exposure at the time of default, and the expected recovery following default. Utilizing historical data, borrower characteristics, and predictive modelling techniques, the ECL method provides precise estimates of potential credit losses. This empowers us to proactively allocate provisions, ensuring compliance with regulatory standards, and enabling more informed, data-driven decision-making.
Definition: ECL is a method of accounting for credit risk that is based on the loss that is likely to occur on a loan or portfolio of loans.
Expected Credit Loss = PD * EAD * LGD
A decision tree model is created where the target variable is Probability of Default (PD)— specifically, whether a borrower defaulted within 12 months or not. The model will segment borrowers based on the likelihood of default. The process works as follows:
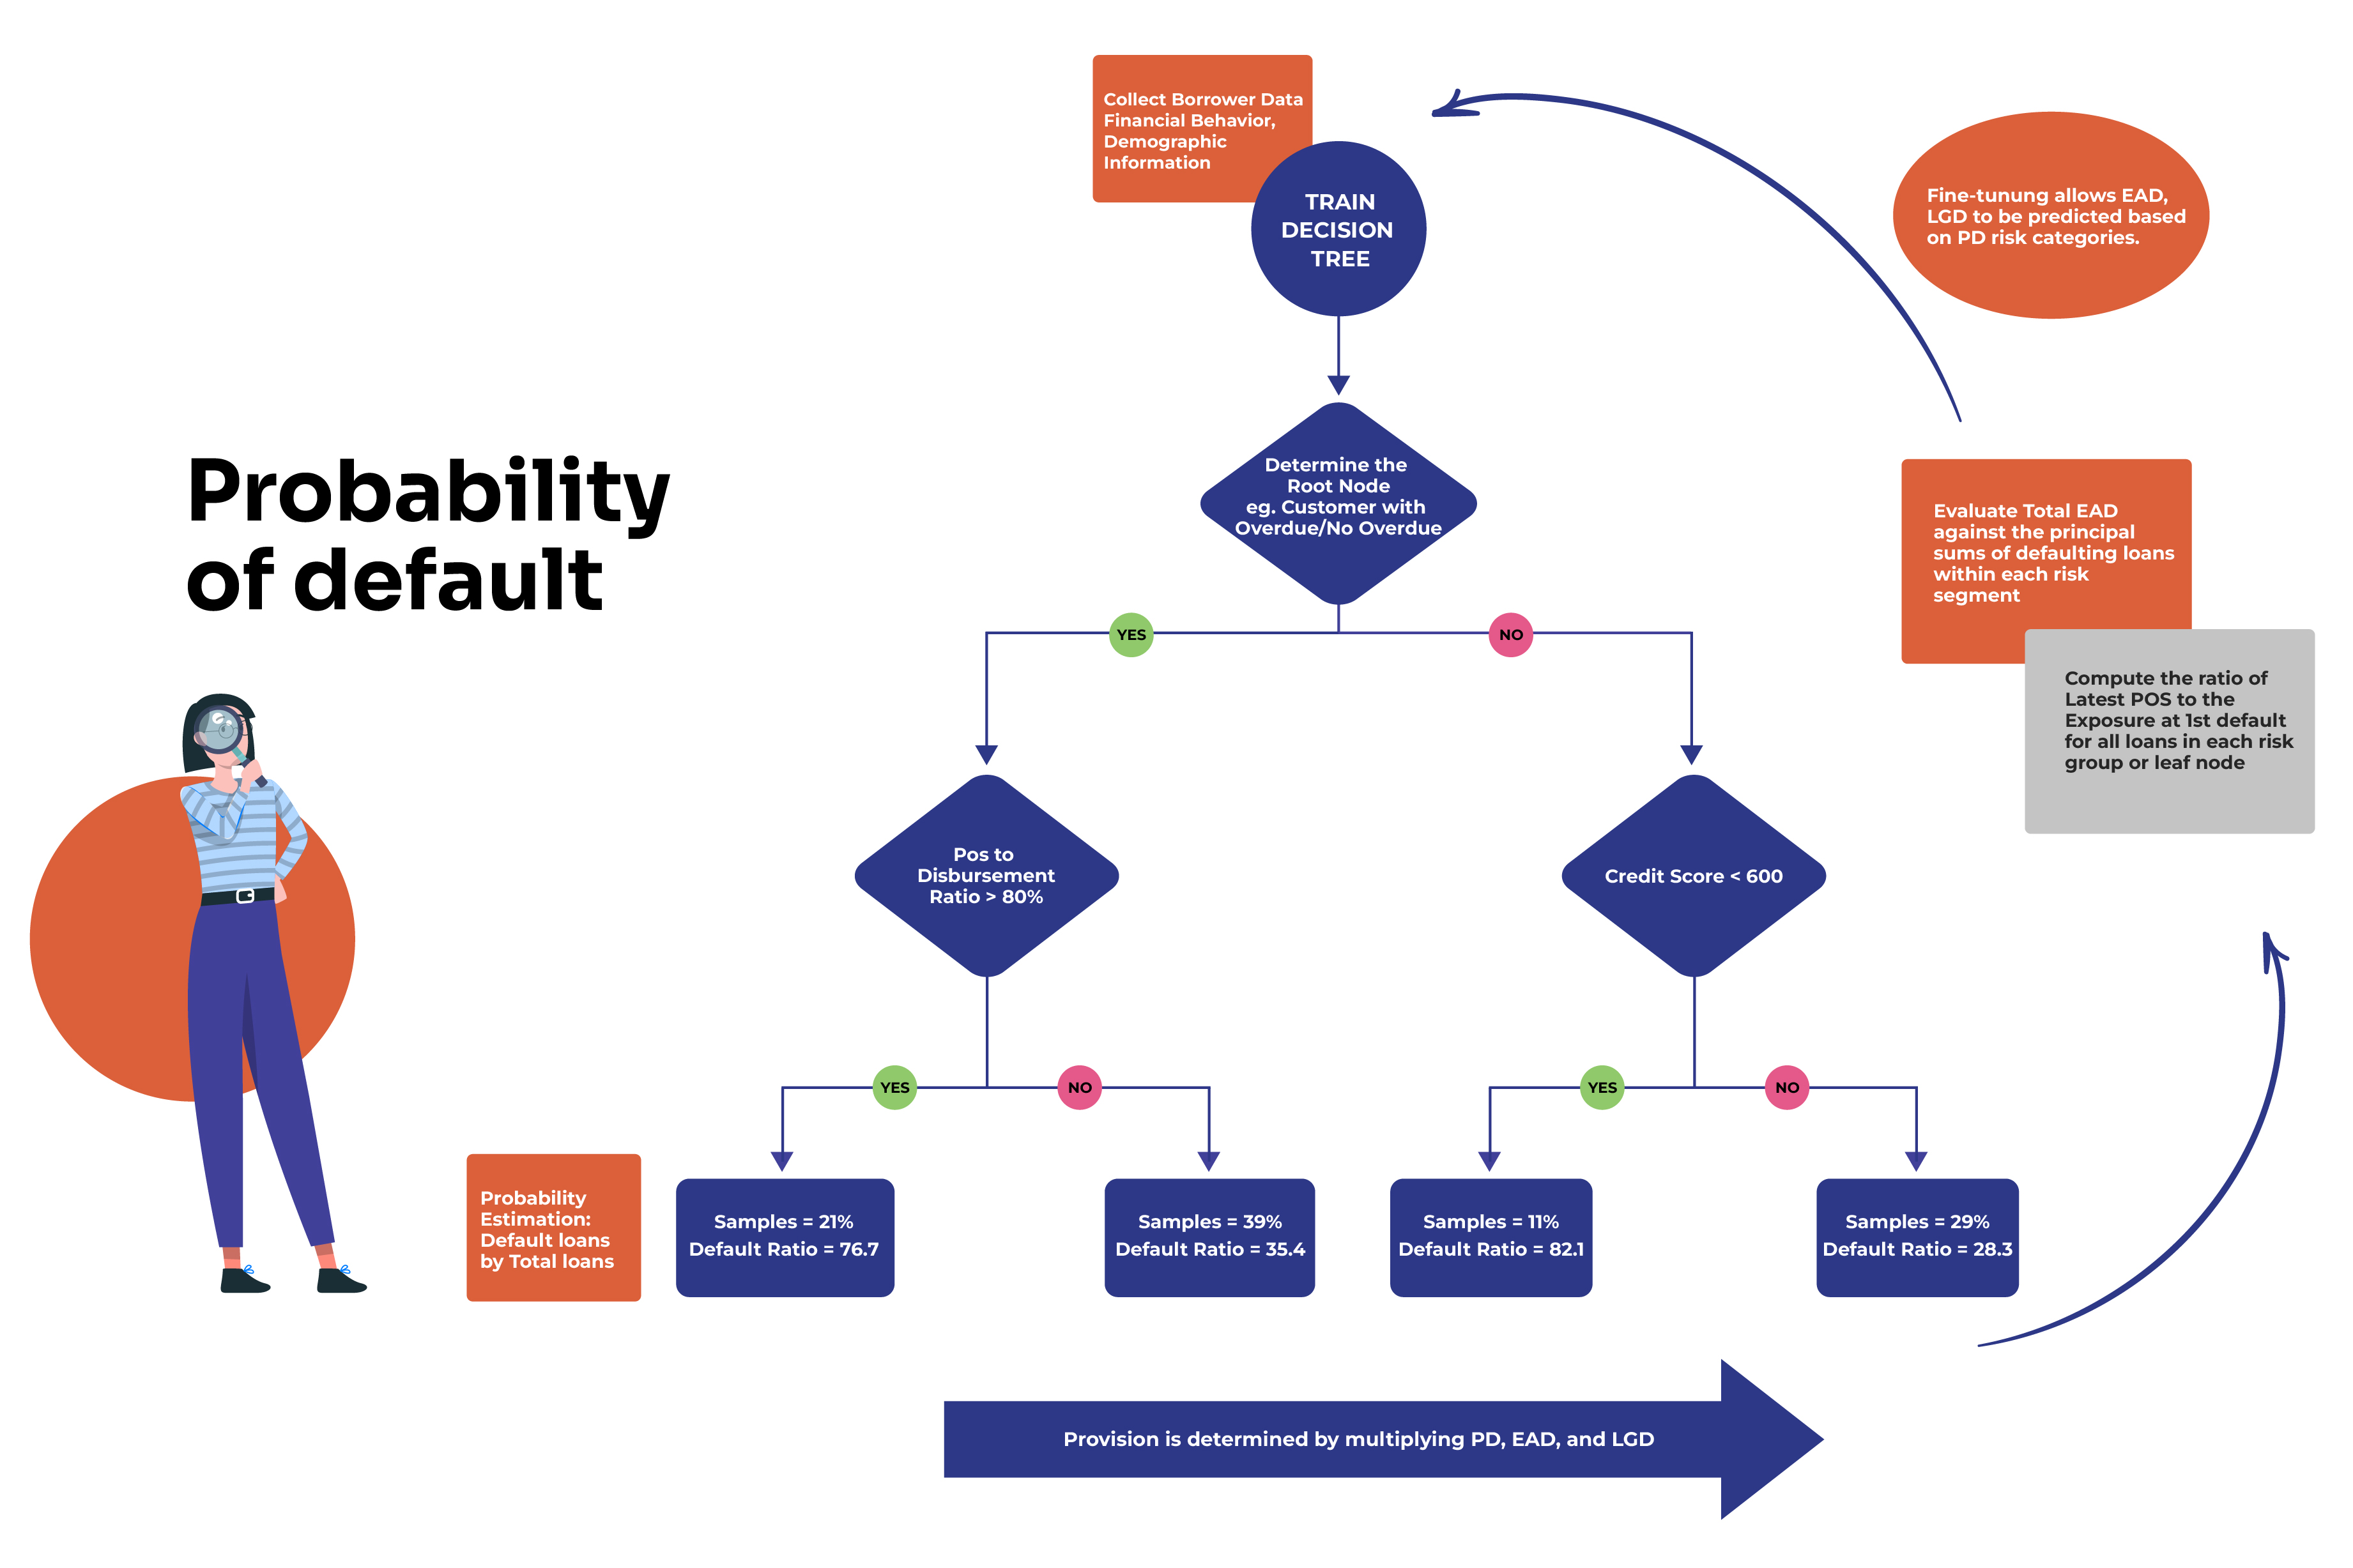
Once the decision tree is trained, each borrower is assigned a Probability of Default (PD) based on the leaf node they land in. The PD for each borrower corresponds to the likelihood that the borrower will default within the next 12 months, based on their features. The leaf node where a borrower lands indicates their risk level: If a borrower ends up in a leaf where many others defaulted, a higher PD is predicted. If they end up in a leaf where defaults were rare, a lower PD is predicted.
The decision tree provides insights into which factors are most predictive of default. By interpreting the tree, financial institutions can make informed lending decisions. For example, if the model shows that borrowers with lower credit scores and higher loan amounts are more likely to default, this can be used to adjust lending policies.
After building the decision tree with PD as the target variable, the next step is to calculate EAD (Exposure at Default) and LGD (Loss Given Default). For each loan in the training set, input the actual EAD (loan principal) and LGD (expected loss given default) values into the decision tree.
Copyright © 2023 Vivriti Capital. All Rights Reserved
Under Construction
Please fill in the details
to cancel the NACH mandate
Please fill in the details to cancel the NACH mandate

Ms Namrata Kaul brings on board over 30 years of global banking experience. She has served as the Managing Director, Corporate and Investment Banking at Deutsche Bank AG. Prior to that she was Head of Asia Business for Deutsche Bank based out of London, involved in multi country interface. Ms Kaul has been involved in developing the strategy roadmap for Deutsche Bank India as part of the India Board and was instrumental in defining and executing the Asia Focus strategy for the EMEA business. She was the founder of Deutsche Bank's Diversity initiative in India. Ms Kaul had earlier worked with ANZ Grindlays Bank in various leadership roles across Treasury, Corporate Banking, Debt Capital Market and Corporate Finance in India and the UK.
Ms Kaul serves on the Board of CARE International. She is a Management Postgraduate from IIM Ahmedabad and has completed a Chevening scholarship on Leadership from London School of Economics.